
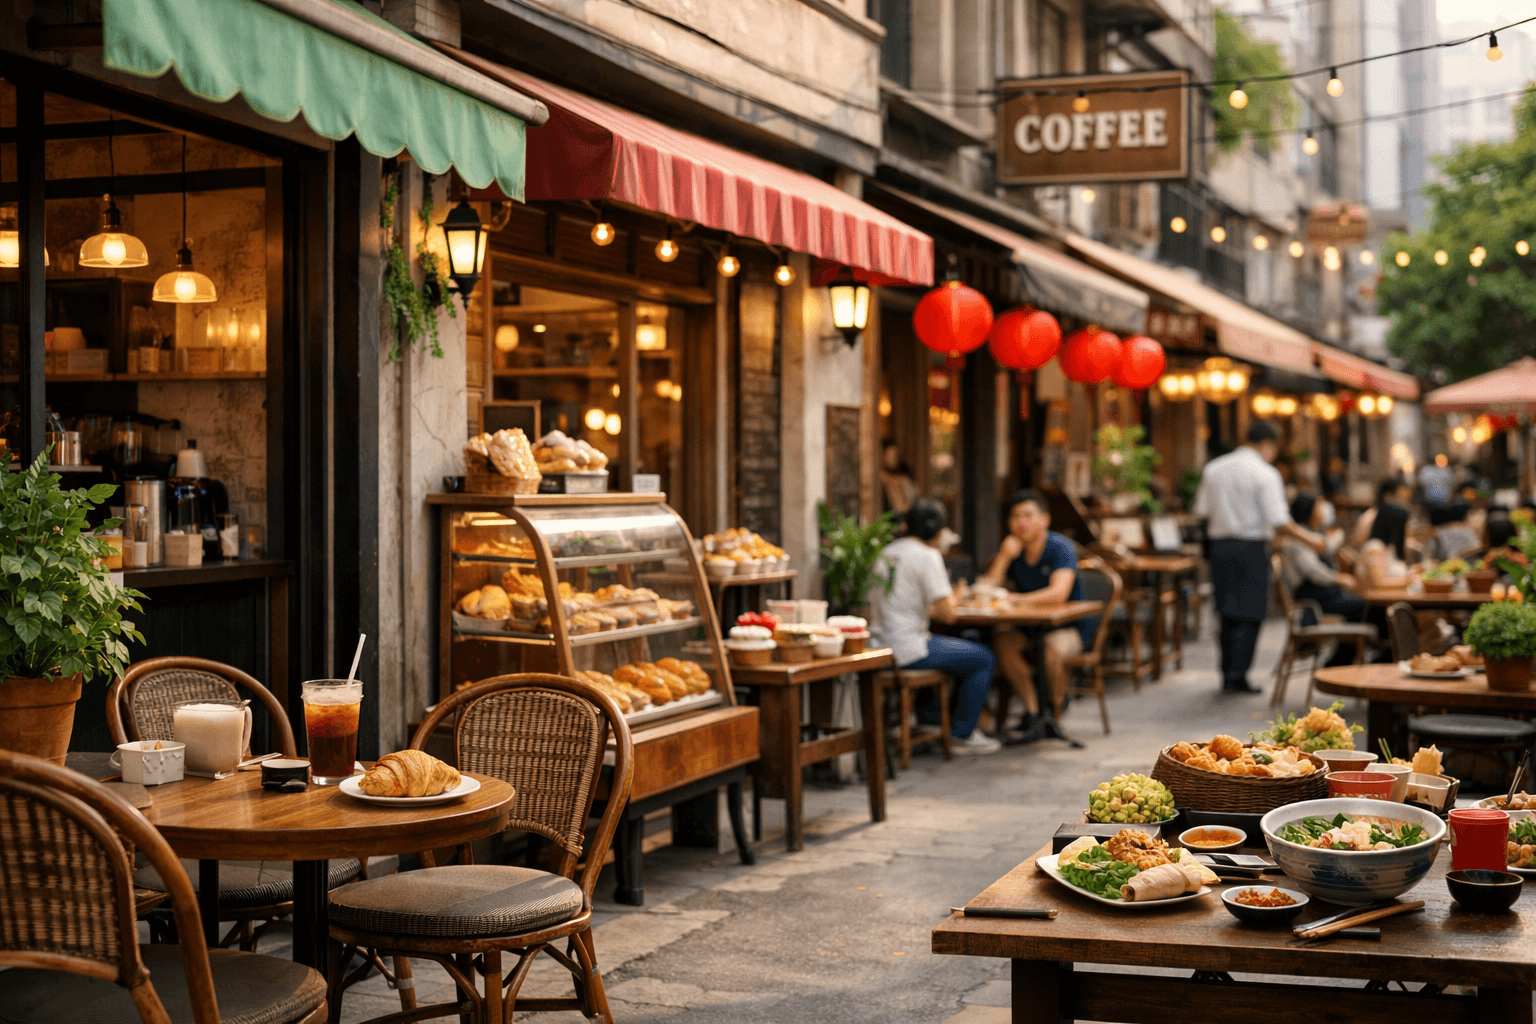
The market is growing, so why do many shops still find it difficult?
Screening the F&B industry market in 2026-2027 begins with a paradox: total spending on eating and drinking is rising, but the share of revenue reaching each shop may not be any higher. As the number of outlets expands rapidly, the bigger pie also has to be divided among more people.
According to VietnamPlus, Vietnam's F&B revenue in the first six months of 2026 was estimated at 432.700 billion dong, up 6,6% year on year. By the end of Q2, the market had around 329.200 food and beverage service outlets, compared with around 299.900 a year earlier. Average revenue per shop has therefore generally remained flat, and may even have fallen slightly.
This follows the slower and more stable growth seen in 2025. According to a report published by iPOS.vn and Nestlé Professional, the market then had around 329.500 shops, up 2% from 2024; revenue reached around 726.500 billion dong, up 5,5%. The industry is still expanding, but growth across the market does not automatically translate into efficiency at outlet level.
Revenue growth needs to be considered alongside prices and seasonality
The 6,6% figure does not fully reflect the improvement in real purchasing power. Lunar New Year in 2025 fell on 29/1, while Lunar New Year in 2026 fell on 17/2. As it came nearly three weeks later, most of the 2026 peak consumption season was recorded in the first six months of the year. Over the same period, average consumer prices rose by 4,4%.
As a result, some of the revenue growth may have come from the price level and the way the peak season was distributed across the calendar, rather than from a corresponding increase in real demand. For shop operators, absolute revenue may rise while the number of orders, customer numbers or retained profit fails to improve.
A more cautious approach is to consider revenue alongside three variables: the number of transactions, the average transaction value and the cost of generating each transaction. New industry developments should also be monitored regularly through the market news section, rather than using a single overall growth rate as the sole basis for business planning.
Spending has not disappeared, but its destination is changing
A survey of 481 F&B businesses in 15 provinces and cities, as cited by VietnamPlus, showed that around 43% of businesses recorded lower revenue than in the same period. Of these, 27,5% saw a fall of between 5% and 20% but remained operational; 15,2% fell by more than 20% and faced significant difficulties.
Conversely, 20,2% of businesses grew by more than 5%, while 37,1% kept their revenue relatively stable. This divergence appeared even among businesses operating in similar local conditions, with similar cost structures and customer groups. The market is not declining across the board; cash flow is being allocated more selectively.
The divergence is also clear between the two business groups. The proportion of food businesses growing by more than 5% reached 25,6%, compared with 15,8% for the beverage group. This difference is not enough to conclude that the beverage model is less attractive. However, it shows that cafés, tea shops and beverage businesses cannot rely solely on widespread market demand to ensure growth.

The screening process is shifting from expansion to operations
According to VietnamPlus, the period after Lunar New Year often puts significant pressure on shops with weak cash flow or an unstable operating foundation. Even so, the total number of outlets at the end of Q2/2026 fell by just 0,1% compared with the end of 2025. New openings offset most of the shops that left the market.
The concern is not only how long a shop can remain in business. As new outlets continue to enter the market, businesses must answer a more difficult question: will the next shop generate additional profit, or will it merely increase revenue across the system while management costs and operational risks rise as well?
When publishing the 2025 report, Vũ Thanh Hùng, General Director of iPOS.vn, said that the market was becoming more mature as growth shifted from mass expansion towards depth, focusing on operational capability, adaptability and the resilience of the model. This is a noteworthy dividing line in 2026-2027 planning: scale only has meaning when a business can control the performance of each outlet.
Four capabilities to assess before expanding
See the performance of each shop clearly
The results of each outlet need to be separated from chain-wide revenue. Managers can compare revenue, the number of transactions, average bill value, ingredient costs, labour costs and the contribution remaining after direct expenses.
If revenue is rising mainly because of prolonged discounting but profit is not improving, that outlet has not created a strong foundation for replication. Conversely, a shop that is not a sales leader but has stable cash flow, consistent quality and easily repeatable processes may provide a more valuable operating model to study.
Protecting cash flow from raw material pressures
The 2025 market report states that 69.38% of the businesses surveyed were under pressure from sharply rising raw material prices. Profit margins have therefore become a test of management, not merely a matter of adjusting selling prices.
A venue needs to distinguish between items that generate revenue, items that generate profit and items that complicate the kitchen or counter while contributing little. Reviewing ingredient quantities, wastage, preparation times and staff schedules should begin with each shift, rather than waiting until the end of the month to discover discrepancies.
Standardising quality and food safety
As a system expands across multiple outlets, quality cannot depend entirely on one person’s experience. Recipes, procedures, storage conditions, utensil hygiene and the handling of deviations need to become processes that can be taught, followed and checked.
FAO describes Codex Alimentarius as a collection of international standards, guidelines and codes of practice intended to protect consumer health while ensuring fair practices in food trade. For an F&B business, its practical significance lies in the control mindset: standards must be present in daily work, not just in the paperwork.

Turning data into decisions at the counter
Sales data is useful only when it helps managers adjust staff schedules, the amount of ingredients prepared, the menu mix or sales programmes. A lengthy report that does not identify off-peak hours, effective add-on items or where wastage occurs has not yet solved the problem.
Owners can also explore the F&B business guide content category to develop a tracking approach suited to their scale. The aim is not to gather as much data as possible, but to maintain a sufficiently clear set of indicators to detect deviations and act early.
Each model needs to answer a different question
Competitive pressure does not affect restaurants, cafés, bakeries and gelato shops in the same way. However, every model must turn market conditions into specific questions at the point of sale.
| Model | Priority question | Signs to monitor |
|---|---|---|
| Restaurants and eateries | Does the menu create too many preparation steps relative to its revenue? | Ingredient wastage, serving time, revenue by item |
| Coffee and tea | Do customers choose the venue for its price, convenience or a distinctive experience? | Number of transactions by time period, average bill value, add-on item rate |
| Bakeries | Does daily output match the actual pace of sales? | End-of-day stock, product mix, production time |
| Gelato and cold desserts | Does the flavour range balance choice with operational complexity? | Revenue by flavour, wastage, ingredient and equipment usage levels |
This is a suggested management framework, not a standard that applies to every business. Monitoring thresholds should be determined according to each operator’s rent, staffing scale, production capacity, business location and cost structure.
The 2027 plan should be built around scenarios
The data currently available reflects 2025 and the first half of 2026, and is not sufficient to confirm a specific growth rate for the whole of 2027. A more practical approach is to prepare three scenarios based on changes in purchasing power, costs and the ability to expand.
- Positive scenario: clearly defines the conditions that must be in place before opening an outlet, including cash flow, management staff and the ability to maintain quality.
- Base scenario: prioritises the performance of existing outlets, reviews the menu and removes steps that do not create clear value.
- Cautious scenario: identifies in advance the expenses that can be cut, the appropriate stock level and the revenue threshold at which the business must take action.
The common thread across all three scenarios is that sector-wide growth is not treated as a guarantee for every business. Screening the F&B industry market in 2026-2027 is likely to differentiate models according to outlet performance, cash flow health and the degree of operational standardisation, rather than simply by the number of outlets.
The key measure is no longer the number of outlets
Rising sector revenue is a positive sign. However, average revenue per outlet remaining almost flat shows that competition has entered a different phase. Businesses are not only competing on location and price; they are also competing on service speed, consistency, cost control and discipline when deciding whether to expand.
For those currently running or preparing to open a venue, the important question is not simply “Is the market still growing?”, but “Can my model maintain its performance as the market becomes more crowded?”. Analyses of restaurants, coffee, beverages, bakery products, technology and human resources are updated in the F&B industry news section.
References
- VietnamPlus: Vietnam’s F&B market recovers amid intensifying competition
- iPOS.vn: 2025 Foodservice Business Market Report in Vietnam
- FAO: Codex Alimentarius and the food safety control system
Partner with Baby Boss
Explore products and Baby Boss services, or call 1900998880.
Shopee · TikTok · Instagram · Threads · YouTube · LinkedIn · Zalo OA · Pinterest
Comments