
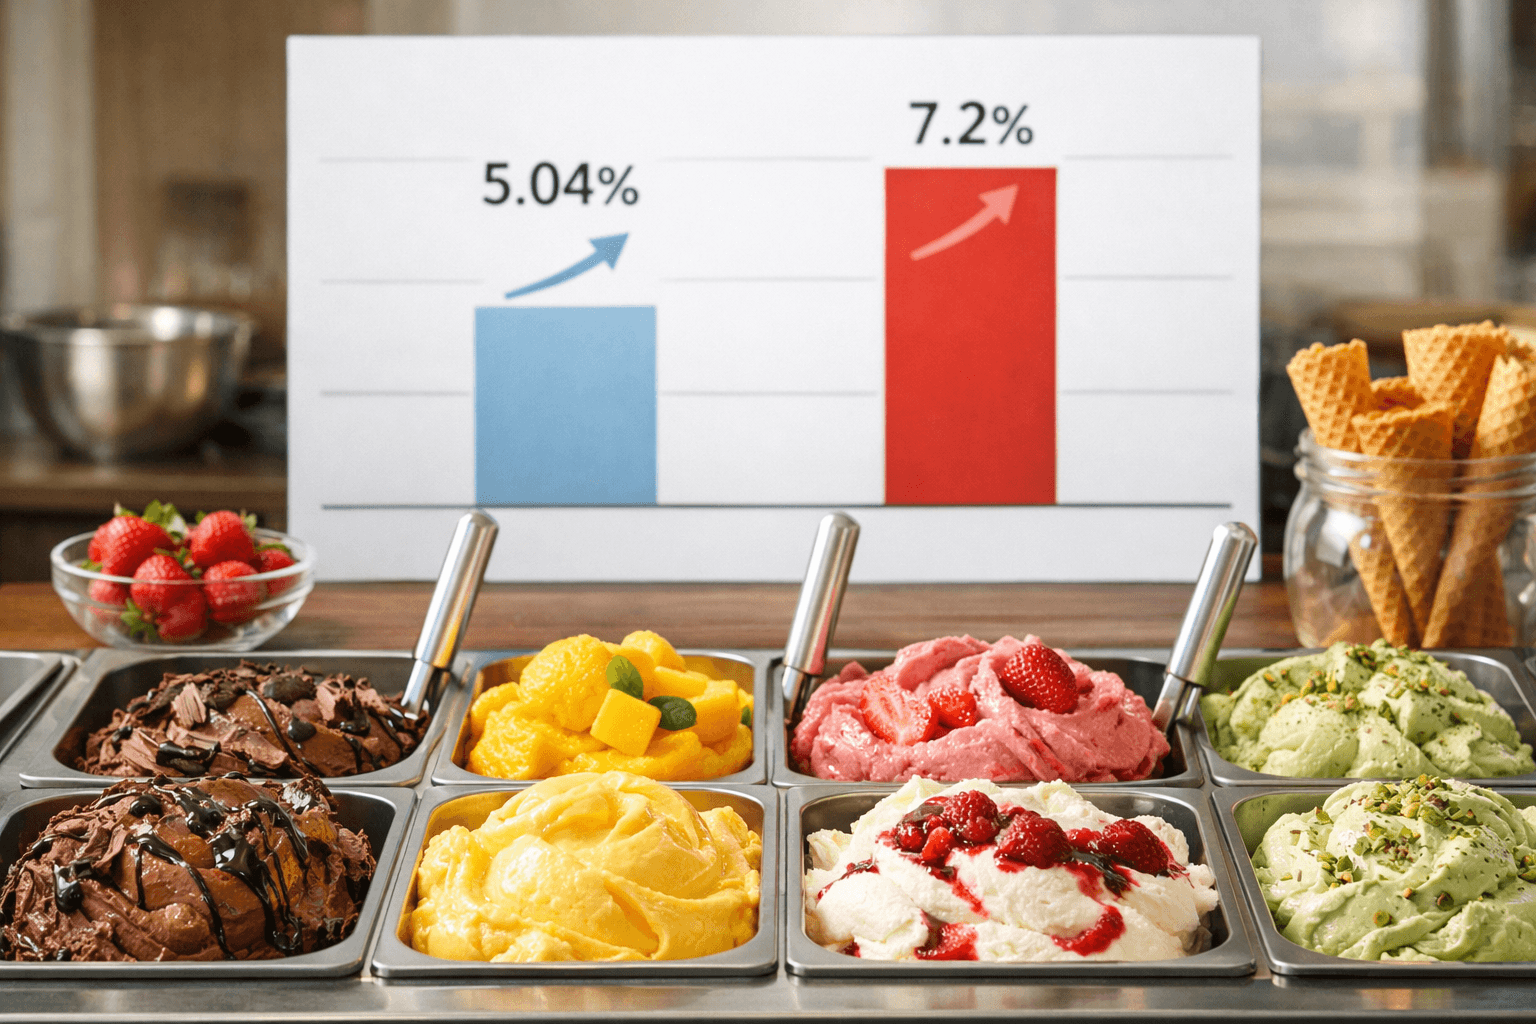
Food and beverage prices are rising in 2026, but consumers have not stopped spending. This is a noteworthy point when the two figures are placed side by side: in Q2/2026, prices in the food and food service category rose 5.04% year on year; while total retail sales of goods and consumer service revenue in the first half of the year rose 7.2% after excluding the price factor.
For a gelato shop, these two figures do not provide an automatic answer on whether to raise or hold prices. They pose a more practical question: is revenue at the counter changing because of selling prices, customer numbers, or because each order contains more products?
Reading the market’s two signals correctly
According to the report presented at the Q2/2026 meeting of the Domestic Market Operations Committee, prices in the food and food service category rose in Q2 5,04% year on year. The report also estimated that total retail sales of goods and consumer service revenue in the first six months of the year reached VND 3,888 trillion, up 12.89%; after excluding the price factor, the actual increase was 7,2%.
So, the overall price level is creating clearer pressure, but growth is not coming solely from buyers having to pay more. Overall consumer demand still showed resilience in the first half of the year.
What matters is the scope of each figure. The 5.04% figure reflects a broad consumer category in Q2; the 7.2% figure covers total retail activity for goods and consumer services over six months. Neither is the growth rate specifically for gelato.
The 5.04% figure is not a price increase formula
A shop should not simply take 5.04% and add it directly to the price of each gelato cup or serving. This index does not show how much ice cream prices alone have risen, nor does it fully reflect the ingredient, premises or operating costs of each business model.
The actual price at each shop also depends on its product range, service format and individual cost structure. Therefore, the 5.04% increase should be viewed as a signal about the overall level of food and beverage prices, not a mandatory adjustment.
A real increase of 7.2% does not guarantee that every outlet is growing
The concept of real growth helps separate the impact of price fluctuations from total nominal revenue. It shows that overall consumer activity continued to grow after excluding the price factor, but it does not mean that every product category, region or shop moved in the same way.
The gap between market-wide figures and counter-level data is where business decisions are made. A market with purchasing power does not mean that every price point will be accepted. Conversely, rising food and beverage prices are not enough to conclude that buyers have reduced their spending on gelato.

Four indicators to look at before total revenue
Total revenue is the final result, but it often obscures the cause. The same increase in revenue may come from more transactions, higher selling prices or more items per order. A shop should track at least the following four indicators:
- Number of transactions: reflects the number of orders generated over the same period.
- Number of products per order: shows whether customers are buying more, buying less or switching to more streamlined orders.
- Average order value: should be read alongside the number of transactions to identify whether revenue is rising because of order value or customer volume.
- Product mix: tracks the proportion of different sizes, flavours, service formats and price bands.
Comparisons should be made weekly or monthly under equivalent operating conditions. Dates when prices change, the product range changes or opening hours are adjusted should also be recorded; otherwise, pre- and post-change data can easily be compared without the correct context.
A shop that is building a tracking system can also refer to the F&B business guide to organise indicators according to the management needs of the outlet.
Three revenue situations require three ways to check
Revenue and the number of transactions do not always move in the same direction. The table below is a framework for reading management data, not a sales forecast for any specific shop.
| Shop-level signal | What may need checking | What to do |
|---|---|---|
| Revenue up, number of transactions up | Demand may be expanding rather than rising solely because of price | Check service capacity, stock shortages and the product groups making the largest contribution |
| Revenue up, number of transactions down | Higher order value may be offsetting the lost transactions | Compare the timing of the price change, the number of items per order and the products with the clearest fall in sales |
| Revenue and number of transactions both down | The cause may relate to demand, pricing, the product range or operations | Narrow it down by time slot, product and outlet before making broad changes |
For example, if revenue rises after a price adjustment but the number of transactions falls, it is still too early to conclude that “raising prices has been effective”. The shop needs to examine the number of products per order and the mix of items sold. Revenue may be maintained in the short term while the number of orders is gradually being lost.
Conversely, an increase in the number of transactions does not necessarily produce a good result if customers all switch to lower-value options. Data only becomes useful when the indicators are read together.
The product range must clarify value at each spending level
As food and beverage prices rise, customers need to see clearly what they receive at each price point. Product names, serving sizes, formats and the differences between options should be specific enough for buyers to weigh them up themselves, rather than having to rely on vague promotional claims.
This is also why shops should not group all gelato into a single category when analysing performance. Products for on-site consumption, handheld formats, different sizes and different flavour groups may serve different needs. Each group should be tracked using its corresponding sales volume and order value.

If several products serve the same need but are difficult to distinguish, the range may become cumbersome without making it easier for customers to choose. Conversely, a clearly structured range will show the shop which products serve as entry points, which help increase order value and which need to be reviewed.
How can Baby Boss apply this signal?
This article was published on Baby Boss's channel. As an organisation with a gelato product range and offering partnership options in this field, Baby Boss does not regard the 5.04% figure as an automatic basis for adjusting prices across the board.
A more practical approach is to separate the data by product format, record precisely when prices or the range change, then compare the number of transactions, the number of items per order and the average order value. For outlets with several product groups, the test scope should be narrow enough to make the cause identifiable.
Businesses reviewing their model can consider the gelato model setup consultancy. The aim of this step is not to impose a one-size-fits-all formula, but to identify the product groups, serving formats and tracking methods suited to the outlet's conditions.
What to retain for the rest of 2026
The 5.04% increase signals pricing pressure in the food and food service group, but it is not evidence that gelato prices must rise by the same amount. Meanwhile, the real increase of 7.2% shows that overall consumption continued to grow in the first half of the year after the price factor was excluded.
These two signals do not contradict each other. They remind businesses to avoid both extremes: underestimating pricing pressure or assuming that purchasing power has weakened. Before making any change, return to the data from the outlet itself — every transaction, every product group and each period before, during and after the adjustment.
Developments related to prices and consumer demand will continue to be updated in Baby Boss's market news section.
References
Partner with Baby Boss
Explore products and Baby Boss services, or call 1900998880.
Shopee · TikTok · Instagram · Threads · YouTube · LinkedIn · Zalo OA · Pinterest
Comments